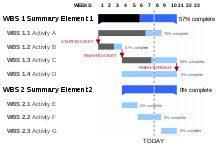
work organization tool in which project schedules are plotted in a bar chart.
Gantt chart (Wikipedia)
A Gantt chart is a bar chart that illustrates a project schedule. It was designed and popularized by Henry Gantt around the years 1910–1915. Modern Gantt charts also show the dependency relationships between activities and the current schedule status.


